
Deal Matrix and Side-by-Side
What it does. Side-by-Side shows the offering memorandum, T-12, rent roll, and a Manual column when you typed figures with no documents. The Deal Index is the working file underneath those columns.
What it uses. Only the documents you uploaded and the values you typed. Blank columns stay blank.
Source, assumption, or result. The columns are source data. A pencil, where it appears, lets you choose which source drives that Deal Index line. That choice is yours. Later tools read the Deal Index, not a fresh average of the documents.
How to use it. Buyers use it to see whether the seller’s price matches trailing operations. Brokers use it to find the lines that need an explanation before a package goes out.
Deal Highlights
What it does. Writes about five to seven short highlights: value, risk, upside, red flags, and next actions.
What it uses. The current Deal Index. Opening the section again rebuilds the highlights from the index as it stands then.
What you can change. Correct the Deal Index or an assumption, then open Deal Highlights again. You are not editing the highlight sentences in place.
How to use it. A fast read before a call. It is a summary of the working file, not a separate underwriting.
Market Analysis
What it does. Writes a market commentary for the property: rent trends, a cap-rate range, absorption, concessions, and how this property is priced against that market.
What it uses. The property location and the deal figures already in the workspace.
What you can change. Location and the Deal Index figures that describe the asset. Open the section again after you correct them.
How to use it. Context for a buyer or a broker narrative. Check any comparable it cites against a source you trust before you put it in a client package.
Debt & Cash Flow
What it does. Looks at leverage: loan sizing, DSCR, year-1 cash flow, and whether the debt structure works at the current price. It also discusses refinance and exit risk.
What it uses. Current-operations debt capacity uses T-12 Actual or T-12 Normalized NOI. Rent-roll income is not used alone to size the loan. Financing inputs in this section are independent of the Pro Forma. Changing the Pro Forma loan does not rewrite this section, and the reverse is also true.
What you can change. Price, NOI source, and the financing assumptions this section asks for. Run it again after a change.
How to use it. A lender conversation starts here: coverage and cash flow at today’s operations, not at a stabilized guess.
Value Add
What it does. Sorts upside into lease-up and stabilization, loss-to-lease, expense savings, ancillary income, rehab, and development.
What it uses. The rent roll, the T-12, and the Deal Index. Items QUAKE cannot verify are listed separately and are not added into the totals.
What you can change. The underlying rents, expenses, and occupancy. Unverified items stay out of the total until they are supported.
How to use it. Brokers use the verified lines in a story. Buyers use the separated list as a diligence checklist, not as NOI.
Analyze the Deal
What it does. Writes the longer review: financial performance, expenses, occupancy, collections, loss-to-lease, whether the T-12 and rent roll tell the same story, and a recommendation.
What it uses. The Deal Index and the documents behind it. It does not calculate a second NOI of its own.
What you can change. Fix a source or a Deal Index pick, then open the section again.
How to use it. The narrative you read before you decide the price is supportable. The recommendation follows the figures currently in the file.
Trailing-12 Analysis
What it does. Lays the T-12 expense categories next to a class-B reference and marks each line HIGH, NORMAL, or LOW.
What it uses. The T-12. If the statement is missing, the section says so.
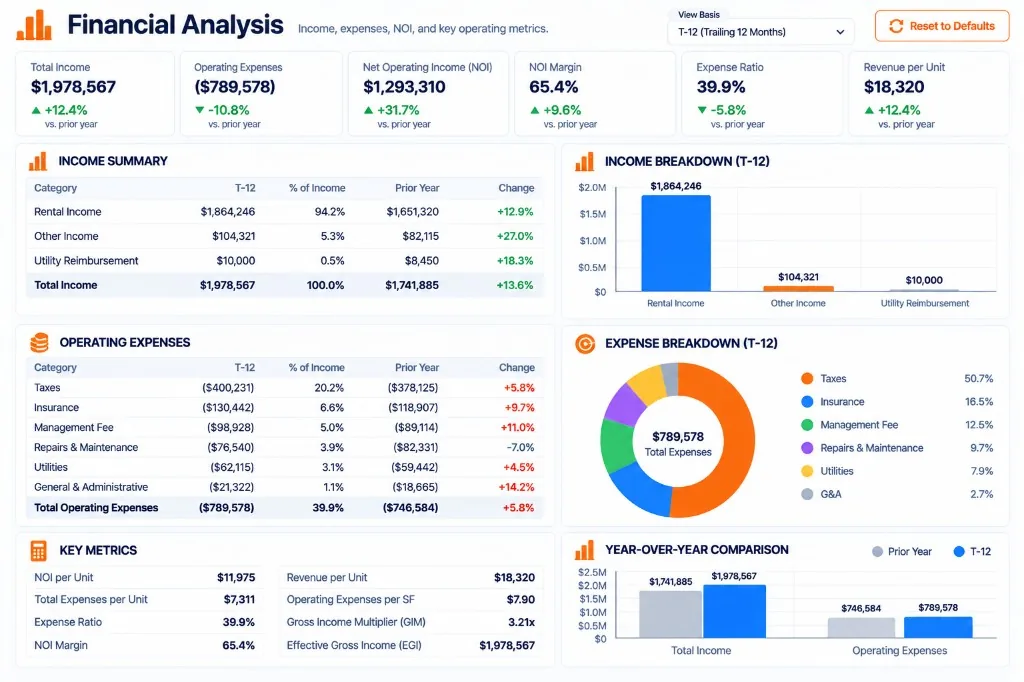
Source versus result. The dollar amounts are source data from the statement. The HIGH, NORMAL, or LOW mark is QUAKE’s comparison with that reference band. It is not a restatement of the seller’s budget.
How to use it. A buyer uses a HIGH line as a question for the tour. A broker uses a NORMAL line to show the expense is in range. Confirm the category mapping before you negotiate from a flag.
Rent Roll Analysis
What it does. Goes through the roll: vacancy, economic occupancy against the T-12, loss-to-lease, concessions, delinquency, unit-type performance, and turnover.
What it uses. The rent roll, and the T-12 when you want the economic comparison. Physical occupancy is occupied units divided by total units.
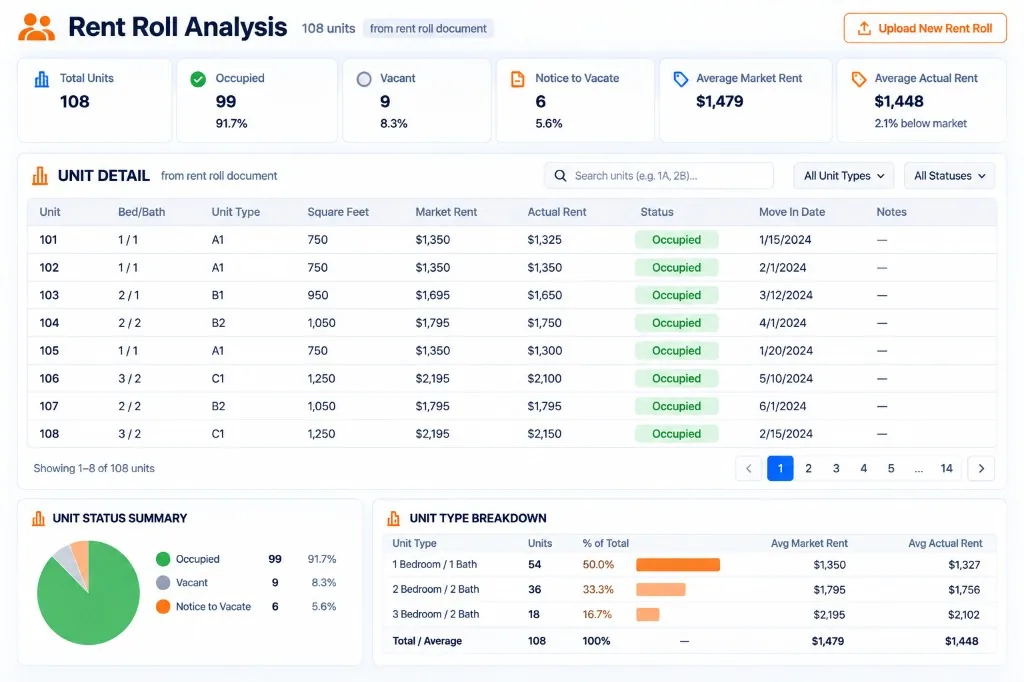
What you can change. Correct the roll and upload it again, or fix the unit counts QUAKE read. Loss-to-lease only appears when both in-place rent and market rent are available.
How to use it. This is the current building. Use it to see whether the upside is a few vacant units or a building that is already full.
Cap Rate Lab
What it does. An interactive cap-rate slider with defensible, stretched, and overpaying zones. Reverse-solve buttons target a 15% internal rate of return, an 8% cash-on-cash return, or a 1.25 debt-service coverage ratio.
What it uses. The NOI already selected in the deal, and the price you are testing. Run All opens the lab. It does not replace the NOI with a new one.
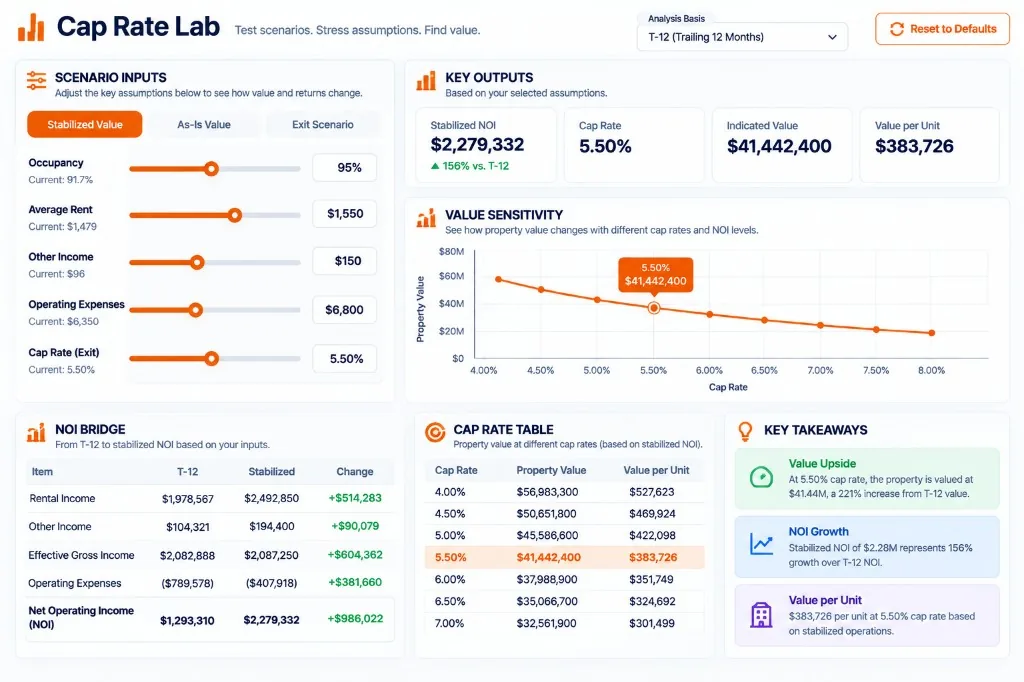
What you can change. The cap rate, and the NOI source before you open the lab. A cap rate on T-12 NOI is not a cap rate on Quake Stabilized NOI. Read the label.
How to use it. Buyers test whether the asking price sits in a range they will defend. Brokers use the same slider to show a price in the defensible zone.
Pro Forma
What it does. Projects years 1 through 10 and calculates returns at the exit year you select. The exit year starts at 10. You can set it lower.
What it uses. Deal Index income and expenses, the rent roll for occupancy, and the assumptions below. Lease-up in the lab and in this projection share the same occupancy path when lease-up is active.
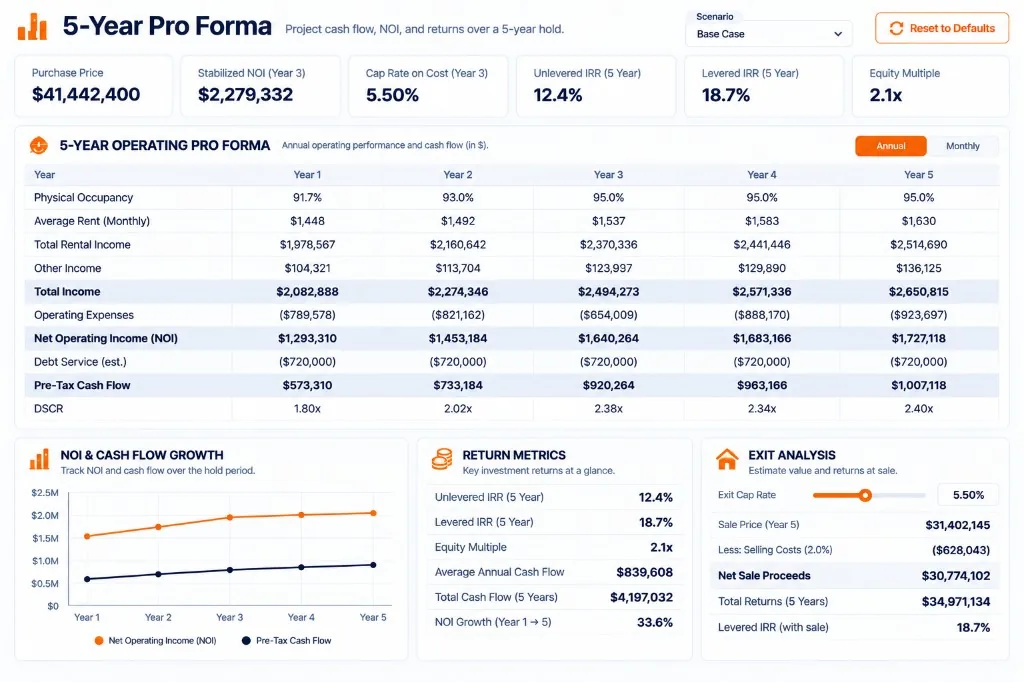
These fields are assumptions. They are not read from the T-12:
- Purchase price — required. Loan and equity are based on it.
- Loan-to-value, starting at 70%.
- Interest rate, starting at 6.5%.
- Amortization, starting at 30 years.
- Annual rent growth, starting at 3%.
- Annual expense growth, starting at 2.5%.
- Exit year, starting at 10.
- Exit cap rate, starting at 6%.
- Selling price — optional. If you enter one, it overrides the exit cap.
- Selling costs, starting at 2%.
Financing here is independent of Debt & Cash Flow. A loan you test in the Pro Forma does not change the debt section, and a loan in the debt section does not change this projection.
What the results mean. Each year shows income, expenses, NOI, debt service, DSCR, and cash flow built from those assumptions. IRR, equity multiple, and cash-on-cash use this hold. They are not a second cap-rate model.
How to use it. Investors use it to see coverage and cash flow through a hold. Brokers use a clearly labeled exit year when they put returns in a package.
When you change an assumption
- Change the source in the Deal Index, or change an assumption in the Pro Forma or Cap Rate Lab.
- Open the section again, or run the Pro Forma again. Narrative sections rebuild from the current file. They do not keep the previous paragraph after the inputs move.
- Run All Analyses if you want every narrative section refreshed together.
- Create the report after the refresh. A report captures the sections as they were when you generated it.
Rent Comps is on the screen and marked Coming Soon. It does not open, and Run All Analyses does not start it.